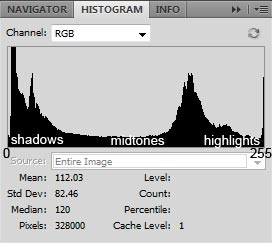
A Histogram is a graph that represents all the pixels in an image, mapped out into an axis that goes from dark to light (or sometimes, light to dark, though that's not how Photoshop does it). Many cameras can show you a histogram as you're making a shot (at least my Canon Powershot G7 does) to tell you if it's looking very bright or very dark or just right. In the example above, you can see that there's a huge peak in the shadows -- that's where most of the pixels are -- then another one in between midtones and highlights, then another small one at the far end of the highlights. Pure black is represented in Photoshop as "Level 0" and Pure white is "Level 255".
However, the best way to learn about histograms is to see how different images have different histograms. To bring it up in Photoshop, just click on the Histogram icon, or select Window > Histogram.
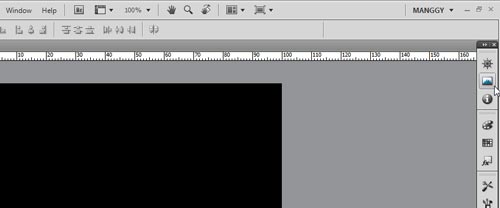
To bring it up in Photoshop Elements, it's... the same thing. All actions here, by the way, can be done in both programs.
You'll notice that the histograms look kind of psychedelic, at least in Photoshop CS4. To bring it to "classic style", just click on the drop-down next to Channel: and choose RGB. On to the examples!
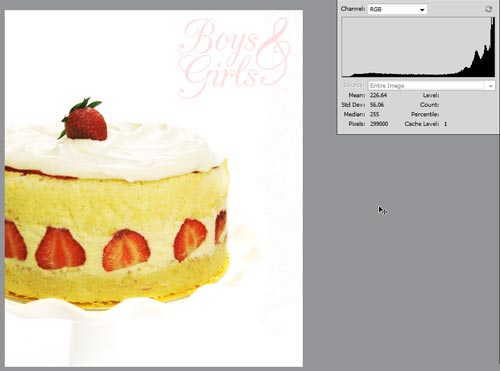
This is an image with very bright values. The stark white background, pale cake, whipped cream, pale yellow pastry cream -- they are all in the "highlights" region on the far right of the histogram. The only kind of dark spots are the strawberries, so there's a few pixels on the far left.
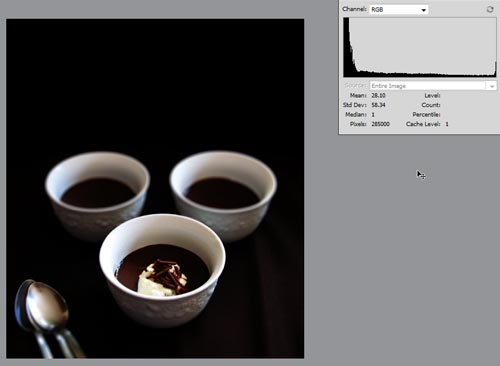
This is an image with very dark values. The dark brown tablecloth, chocolate pots de creme, dark shadow overhead -- they form a sharp peak in the "shadows" region on the far left of the histogram. You'll notice there is a short peak on the far right also, though not as tall as the one on the left. These highlights are the highlights on the white ceramic pots.
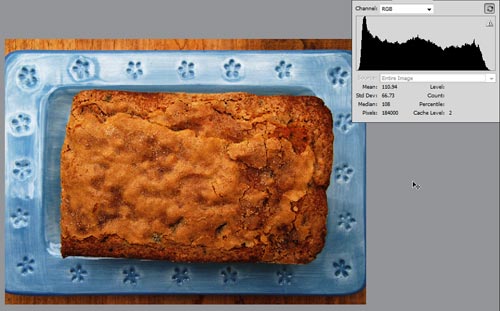
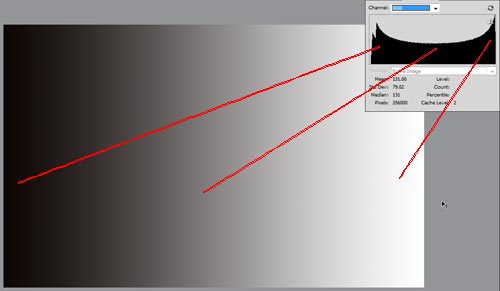
This is a balanced image with an almost-equal distribution of shadows, midtones, and (to a smaller extent) highlights. It's important to note that there aren't necessarily any "good" or "bad" histograms. Just because the histogram is flat with no sharp peaks doesn't make the image nice to look at (or vice versa). It all depends on what mood you want to portray.

But speaking of bad images, take a look at this underexposed one. There are no shadows or highlights -- all the pixels are sort of gray, and a picture that lacks contrast has this histogram: a single peak in the midtones. This can still be a good histogram, if for example you fancy those kind of low-contrast polaroid shots that have an "aged" look.
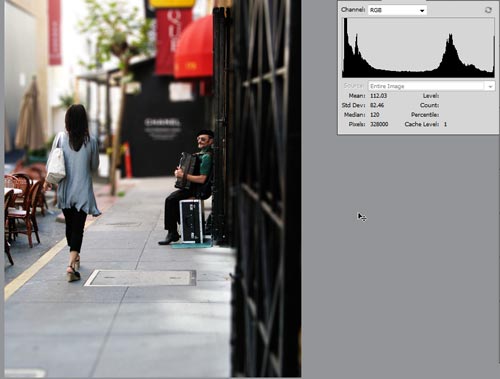
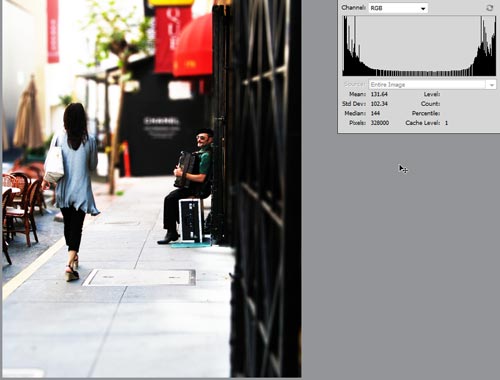
Everyone has their own taste, but I like some contrast in my images. In this travel photo we have a peak in the shadows, a peak in the lighter midtones, and a short peak in the highlights.
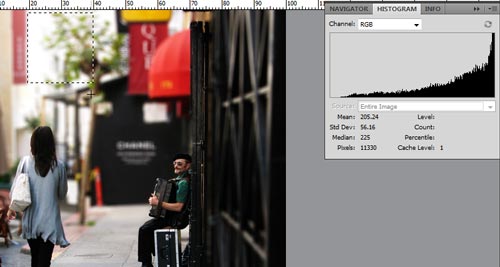
To get the histogram of only isolated areas of the image, simply select an area and the histogram will automatically reflect that (this also works in Photoshop Elements). As you can see, the background of the image is mostly highlights.
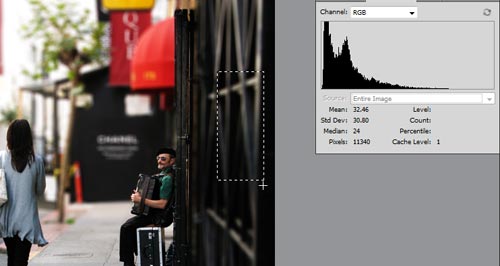
The gate is mostly shadows...
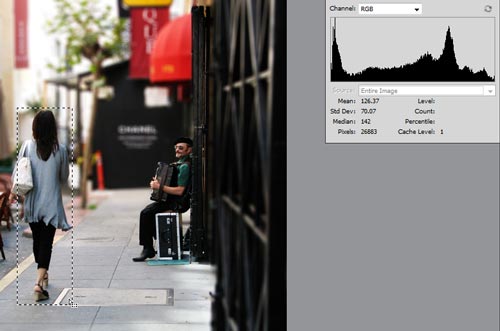
... and the woman has a good distribution of highlights, midtones, and shadows.
To view the histogram of only a single layer, just choose from the Source: drop-down (in the examples you'll see it just says "Entire Image").
In our next lesson you'll learn that making image adjustments alters the histogram in specific ways. Here is the same image, but with greater contrast: notice that the peaks in the histogram spread wide open into the shadows and the highlights.
Assignment! Keep a folder of saved (scanned or picked off the internet - just don't republish them, lol) images that you like and look at their histograms in Photoshop/Elements. Can you see how good lighting and contrast translates to the histogram? Can you pinpoint peaks and low areas in the histogram and find what areas of the image they refer to? Now look at some images, either your own or other people, that could use a little work on the lighting, exposure, and contrast, and what their histograms look like. How do they compare to histograms of images that you do like?
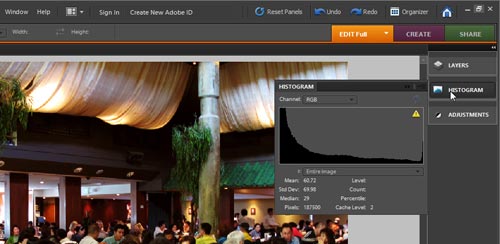
And a final note, just in case you were wondering: what is that exclamation point (!) that sometimes shows up on the histogram? Well, in the interest of faster performance, Photoshop makes a new histogram all the time by getting a quick sampling of small areas of your image instead of the whole image. It's just a warning that's saying the histogram may not accurately represent the whole image. Clicking on it refreshes the histogram and makes a perfect representation of the whole image, but usually the difference is not really that great.


